Common size analysis is the analysis of
financial statement items through comparisons among these items.
In common size analysis, we compare each item in a financial
statement with a benchmark item:
To see how this works, consider General Motors' financial
statements below. The reported financial data in the right-most columns has
been converted into percentages of sales revenues (i.e., common size
statements), shown in the left-most columns:
|
stated as a % of Sales |
| ||||||
| 1997 | 1996 | 1995 | 1997 | 1996 | 1995 | ||
| Sales | 100.0% | 100.0% | 100.0% | $178,174 | $164,013 | $160,254 | |
| Cost of sales | 73.0% | 75.1% | 75.7% | $130,028 | $123,195 | $121,300 | |
| Gross profit | 27.0% | 24.9% | 24.3% | $48,146 | $40,818 | $38,954 | |
| Selling, general, and administrative expenses | 9.1% | 8.9% | 7.8% | $0 | $0 | -$52 | |
| Net income | 3.8% | 3.0% | 4.3% | $6,698 | $4,963 | $6,881 | |
| Premium on exchange of preference stocks | 0.0% | 0.0% | 0.1% | $26 | $0 | $153 | |
| Dividends on preference stocks | 0.0% | 0.0% | 0.1% | $72 | $81 | $211 | |
| Earnings on common stocks | 3.7% | 3.0% | 4.1% | $6,600 | $4,882 | $6,517 | |
Exhibit 1
|
We can restate General Motors' reported balance sheet items in terms a percentage of total assets:
|
stated as a % of total assets |
| |||||
| 1997 | 1996 | 1997 | 1996 | |||
| Cash, cash equiv., and marketable securities | 10.0% | 10.0% | $22,984 | $22,262 | ||
| Finance receivables | 25.7% | 25.9% | $58,870 | $57,550 | ||
| Accounts receivable | 3.3% | 3.0% | $7,493 | $6,557 | ||
| Inventories | 5.3% | 5.4% | $12,102 | $11,898 | ||
| Deferred income taxes | 9.8% | 8.8% | $22,478 | $19,510 | ||
| Equipment on operating leases | 14.5% | 13.6% | $33,302 | $30,112 | ||
| Property | 15.1% | 16.9% | $34,567 | $37,504 | ||
| Intangible assets | 5.0% | 5.7% | $11,469 | $12,691 | ||
| Other assets | 11.2% | 10.8% | $25,623 | $24,058 | ||
| Total assets | 100% | 100% | $228,888 | $222,142 | ||
We can represent the asset accounts graphically, as shown in Exhibit 2.
Exhibit 2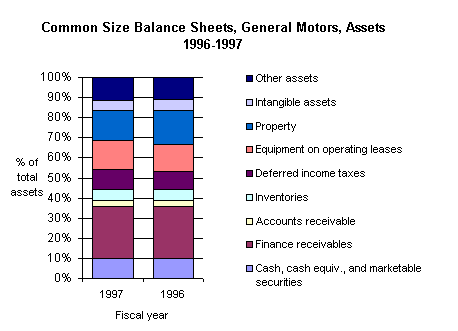
|
In a similar manner, the liabilities and equity can be restated in terms of total assets:
|
stated as a % of total assets |
| ||||||
| 1997 | 1996 | 1997 | 1996 | ||||
| Accounts payable | 6.9% | 6.4% | $15,782 | $14,221 | |||
| Notes and loans payable | 40.6% | 38.4% | $93,027 | $85,300 | |||
| Deferred income taxes | 1.3% | 1.4% | $2,923 | $3,196 | |||
| Postretirement benefits other than pensions | 18.0% | 19.4% | $41,168 | $43,190 | |||
| Pensions | 3.1% | 3.4% | $7,043 | $7,581 | |||
| Accrued expenses and other liabilities | 22.1% | 20.3% | $50,490 | $45,144 | |||
| Minority interests | 0.3% | 0.0% | $727 | $92 | |||
| Debentures | 0.1% | 0.0% | $222 | $0 | |||
| Stockholders' equity | 7.6% | 10.5% | $17,506 | $23,418 | |||
| Total liabilities and equity | 100% | 100% | $228,888 | $222,142 | |||
We can represent this breakdown graphically, as shown in Exhibit 3, which allows us to see the changes in the firm's capital structure over time.
Exhibit 3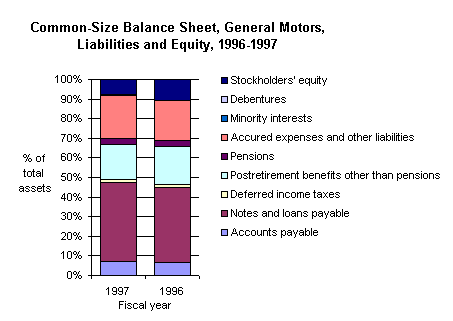
|
Common size analysis is useful in analyzing trends in
profitability (using the common size income statements) and trends in
investments and financing (using the common size balance sheet).
As we learned in the discussion of financial ratios, we can use financial ratios along with other pertinent data to evaluate the financial condition and operating performance of a company. Though a single ratio for a given company at a point in time tells us very little, if we examine the trends in the ratios over time and compare these trends with those of firms in similar lines of business, we can get a good idea of where this company has been -- financially speaking -- and where it may be heading. Therefore, the analysis of financial ratios and other information involves examining:
- trends over time for the company,
- trends over time for companies in similar lines of business, and
- economic and market conditions.
To make comparisons, the analyst most likely will want to compare the firm with other firms. But identifying the other firms in the same or similar lines of business presents a challenge. A system that has been used for many years for classifying firms by lines of business is the Standard Industrial Classification (SIC) system, which was developed by the Office of Management and Budget. However, starting in 1997, another classification system, North American Industry Classification System (NAISC) replaces SIC codes with a system that better represents the current lines of business. Using the NAISC, we can classify a firm and then compare this firm with other of that class.
Classifying firms into industry groups is difficult because most firms have more than one line of business. Most large corporations operate in several lines of business. Do we classify a firm into an industry by the line of business that represents:
- the most sales revenue generated?
- the greatest investment in assets?
- the greatest share of the firm's profits?
It is not clear which is the most appropriate method and a firm may be classified into different industries by different financial services and analysts.
In making comparisons, there is an issue of whether the benchmark should be all other firms in the industry (say, an average), or the leading firms in the industry. Consider the case of Dow Chemical. Dow Chemical is a manufacturer of basic chemicals. The primary competitors to Dow Chemical in this industry are E. I. du Pont de Nemours and Union Carbide, though there are also a number of smaller competitors such as Georgia Gulf and Millenium Chemicals. The breakdown of sales in this industry for 1997 is shown in Exhibit 4.
Exhibit 4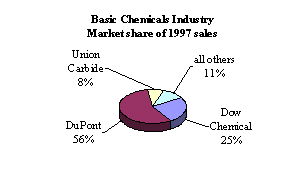
|
When comparing Dow Chemical to the industry,
- Should we use just the two major competitors as the industry benchmark? If so, so we simply average Du Pont's and Union Carbide's ratios or do we weight them in some manner (e.g., by market share)?
- Should we consider the smaller competitors at all?
- Should we compare Dow Chemical with the largest or the most profitable firm in the industry?
The benchmark that we choose may affect the conclusions that we draw with respect to a firm's operating performance.
Let's see how we would use information over time for the
company and the industry. Consider the return on equity for Dow Chemical as
compared to the industry, as shown in Exhibit 5, where the industry is defined
as the two largest competitors, DuPont and Union Carbide.
Exhibit 5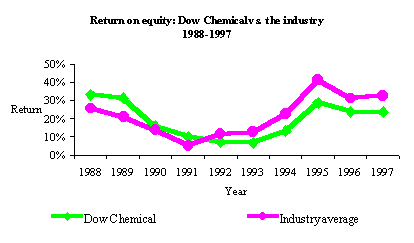
|
We see that the downturn in the return on equity for Dow Chemical mirrors that of the rest of the industry and that, in general, Dow Chemical provides a return on equity that follows the industry trends. Examining information on the economy over this same period, we see that the downturn in the basic chemical industry's returns corresponds to a recessionary economic environment, as suggested by various economic indicators. (You can find information and data on economic indicators at many sites; probably the most complete set of data is from the FRED system at the Federal Reserve Bank at St. Louis.)
Comparing Dow Chemical's debt-equity ratio, as shown in Exhibit 6, we can see that Dow Chemical's financial leverage is similar to that of the industry, though while the industry reduced its relative use of debt in the early years, the Dow Chemical increased its relative use of debt.
Exhibit 6 |
Creditworthiness
One use of financial analysis is to evaluate the credit-worthiness or debt quality of a business.Credit-rating services (e.g., Dun & Bradstreet, Standard & Poor's, and Moody's Investor Service) provide an evaluation of a firm's ability to meet its obligations. Rating services use both financial analysis and the characteristics of the obligations to evaluate credit-worthiness.
Bond ratings reflect the credit quality of a particular debt issue. These ratings reflect not only the credit-worthiness of the issuer, but also the features of the debt issue, such as security or a sinking fund. Bonds are often classified according to credit quality. Bond ratings for both Moody's and Standard & Poor's are summarized in Table 1.
We can classify bonds into broader groups based on these ratings: investment grade debt and non-investment grade debt. Investment grade debt is debt with little credit risk -- the borrowers are expected to be able to pay the promised interest and principal. In terms of the bond ratings in Table 1, investment grade debt encompasses the top four rating classes (AAA through BBB for Standard and Poor's and Aaa through Baa for Moody's). Non-investment grade debt, also referred to as junk bonds or speculative grade debt, on the other hand, are debt securities with a great deal of credit risk -- that is, there is a good chance the borrowers will not be able to pay the promised interest and principal.
Predicting bankruptcy
Financial analysis is often used to evaluate the likelihood that a firm will be unable to pay its obligations. We can see that there are often indications of a firm's financial distress prior to the actual declaration of bankrutpcy. Consider Laclede Steel, a firm that declared bankruptcy in November of 1998. Laclede Steel was generating losses for several years, as indicated by the return on assets shown in Exhibit 7.
Exhibit 7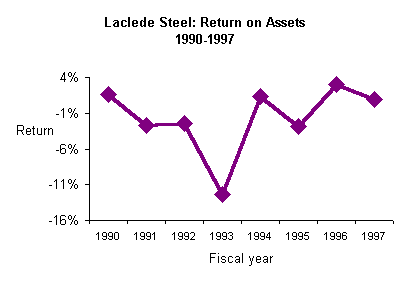
|
Despite efforts to improve sales, profitability was never sufficient to help Laclede recover, as indicated in Exhibit 8.
Exhibit 8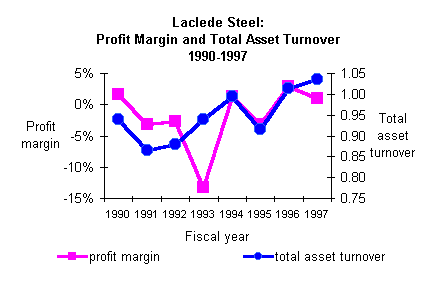 |
The lack of profitability eventually caused a depletion in retained earnings and too heavy a reliance on debt financing, as shown in Exhibit 9.
Exhibit 9 |
Because financial distress is generally signalled through financial characteristics well before a formal bankrutpcy, as in the case of Laclede, statistical models are often used to discriminate between financially healthy and financially unhealthy firms based on financial ratios or other characteristics over several years. The general characteristics of a firm used in these models include liquidity, profitability, financial leverage, and asset turnover. Statistical models employ techniques such as discriminant analysis and regression analysis to identify the characteristics of firms most likely to experience difficulty meeting financial obligations. In the case of discriminant analysis, for example, scores are calculated based on financial ratios and these scores are then associated with the likelihood of financial distress.
Using accounting data
There are a number of issues that arise simply from the fact that much of the financial data we use in analysis is accounting information. The problems associated with using reported accounting data include:
- Use of historical costs and inflation. Accounting data are not adjusted for inflation and represent historical cost instead of current or replacement costs for most assets. It is likely that the reported book value of assets do not relfect the market value or replacement value of a firm's assets.
- The different methods of accounting. Firms can select from alternative accounting procedures (e.g., LIFO vs. FIFO), which makes comparisons among firms difficult. The analyst must often look beyond the basic financial statement information to remove distortions that may arise from apecific accounting practices.
- The occurence of extraordinary and special items. The analyst must determine whether the effects of extraordinary and special items should be included in the analysis. In recent years, extraordinary items have become quite "ordinary", with some firms reported extraordinary items each year.
- The difficulty in classify "fuzzy" items. Some accounting items are difficult to classify, especially when distinguishing between liabilities and equity accounts. Therefore, the analyst must understand not only the accounting principles behind the numbers, but also understand business practices. For example, in the case of the deferred taxes, the analyst must understand not only what gives rise to the deferred taxes, but whether this accounting item represents an on-going difference between tax and accounting income (and, hence, is more suitably classified as equity) or whether this item represents a temporary timing difference (and, hence, is more suitably classified as a liability).
Selecting and interpreting ratios
Interpretation of ratios one at a time is difficult since there is no "good" or "bad" value when viewed in isolation. Ratios should be selected that have meaning for that firm. For example, inventory turnover for a hospital doesn't make much sense. What is inventory for a hospital? Bedpans? But inventory turnover is very important for, say, a retailer such as Wal-Mart.
Further, some ratios do not make sense under certain circumstances. For example, if a firm has negative earnings, the price-earnings ratio is meaningless. As another example, consider a firm that has negative book value of equity (and, yes, this can happen). In this case, any ratio that uses book value of equity, such as the debt-equity ratio, is meaningless.
Forecasting
We often examine trends in ratios and other financial data to predict the future, forecasting the future based on historical trends. For example, we may extrapole a trend in sales or a trend in operating profit. And though this may result in a reasonable forecast for the immediate future, the business environment is very complex and many factors can affect the future performance or conditions of a company. Therefore, we generally develop forecasts using information in addition to the basic trend, such as forecasts of economic and market conditions.
We can also look to analysts' forecasts. We could look to individual analysts' forecasts or look at consensus forecasts collected by financial service firms including IBES, Zack's, and First Call. This information is reported by many web-based services, including Yahoo! Finance. For example, we can see the consensus forecasts for USX-U.S. Steel, as reported by Yahoo!, which tells us not only whether there was an earnings surprise (that is, actual earnings deviated from consensus or expected earnings) for the latest quarter, but the consensus forecast for the next quarter, the next reported fiscal year, and one-year ahead.